What is my data trying to tell me? An Introduction to Statistical Significance and Inference

So, you've successfully designed a scientific experiment to prove your theory. You've isolated your variables, made a reasonable hypothesis, set up your equipment, conducted the experiment, and collected your data. The only step that stands between you and your shiny Nobel Prize that comes with all its fame and glory is the final step of any well-conducted experiment based on the scientific method: understanding what exactly your data is trying to tell you.
In other words, this step involves coming up with logical inferences from your data.
An inference is a conclusion drawn from data based on evidence and reasoning. When you perform an experiment, you will have likely collected some data from it; when you wish to state any conclusion about the data, you need statistics to show that your conclusion is valid. In other words, you must show that the trend you see isn’t due to random chance, error or noise. Only then can you claim that your conclusion is statistically significant. One of the most common methods to do this is to use p-values.
Hypotheses
A hypothesis is a statement of a theory or a claim. The null hypothesis $(H_0)$ and the alternative hypothesis $(H_1)$ are two competing claims that completely cover the set of possibilities, where $H_1$ is the hypothesis you are trying to prove through your experiment. For example, if a flat-earther were trying to show that the earth is flat, his $H_0$ would be the statement "The earth is not flat" while $H_1$ would be "The earth is flat" (although, in hindsight, a flat-earther would probably not be using the scientific method in the first place).
In order to prove the alternative hypothesis, your burden is to simply show that the data contradicts $H_0$ beyond reasonable doubt, thus enabling us to reject it and accept $H_1$ as true. However, if the data does not contradict $H_0$ beyond reasonable doubt, it means that we can’t rule it out as an explanation, even though it may not actually be true.
p-value
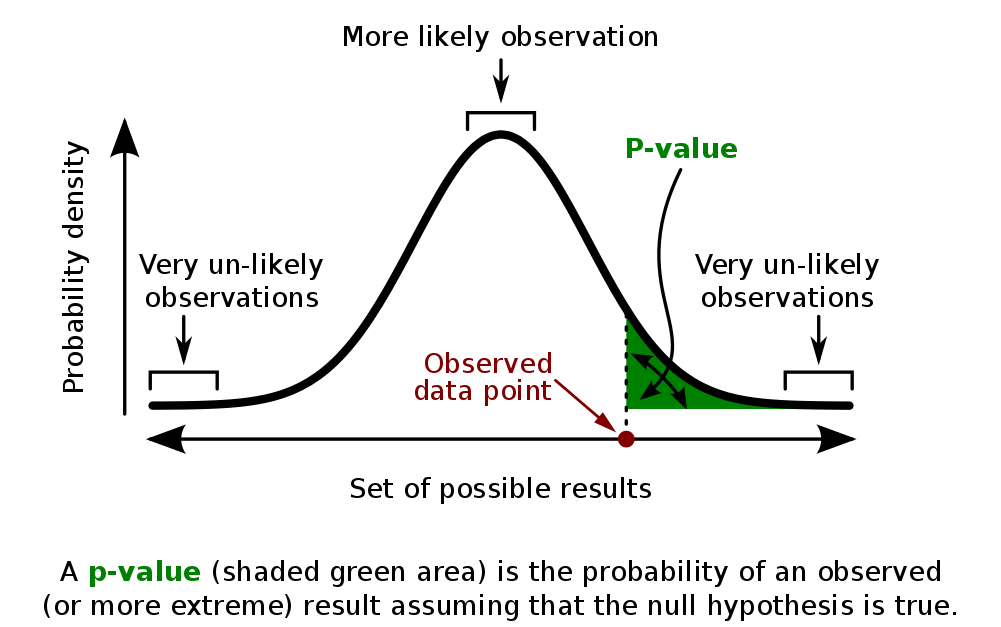
The p-value of a test is the probability, given that the null hypothesis is true, of observing a result at least as extreme as the one actually observed. The lower the p-value, the more likely $H_1$ is true. There are various standards for what probability is low enough for the hypothesis to be considered statistically significant, but in most scientific literature, the commonly used value is 0.05.
Think of this as a ‘cut-off’ of sorts: if the p-value is less than 0.05, then the probability that your data was because of random chance or coincidence is less than 5%, which is small enough to ‘reject’ the null hypothesis and accept the alternative hypothesis, i.e., the one you are trying to prove, as true beyond reasonable doubt. In the distribution shown below, the green area represents the p-value of the data. If this green area falls within the 0.05 interval, $H_0$ can be rejected.
Calculating the p-value manually is beyond the scope of this article, but scientists usually use statistical software or calculators to do the work for them, rather than doing it by hand or looking it up on a table.
If you are completely lost at this point, don’t fret; we’ll take up an example to understand this a little better. Let’s say you have a friend who claims he finishes his lunch, on average, in not more than 20 minutes, but you have reason to believe otherwise. You hence want to design an experiment to prove him wrong. In that case, your hypotheses will be:
$$H_0: \mu \leq 20$$ $$H_1: \mu > 20$$ where $\mu$ is the population mean.
You carefully measure the time he takes for lunch over the next few days (unbeknownst to him, of course) and find the average time taken (the sample mean) to be 25 minutes. At this point, you notice that it is likely that he is lying, but you're not sure how likely it is. So, you run your data against a p-value calculator, which spits out a p-value of 0.01. This means that the probability that you will be wrong in rejecting your friend’s claim that he finishes his lunch in less than or equal to 20 minutes is just 1%! Since this is less than the cut-off of 0.05, you can successfully conclude that your friend is wrong. Of course, it could also be that you are wrong by having sampled your friend’s eating times on some very specific days when he was unusually slow, but, as the p-value shows, that scenario is highly unlikely.
Yes, the p-value does have its own pitfalls and limitations and has long been a source of controversy and misconception in published literature, but it is still an incredibly useful tool (and one of the most accepted measures) for depicting the significance and credibility of one’s data, regardless of the field of study.